
It’s crunch time. Don’t be surprised to find all sorts of friends and family members on edge this week as they work feverishly to finish the task they’ve been putting off. Doing their taxes. Most won’t have a clue where the money is going, either.
In fact, millions of Americans will file their 2015 federal income tax returns this week with absolutely no idea what the government actually does with their tax dollars. And yet, nearly half of all federal revenues come from individual income taxes, which is why the folks at one organization feel that the federal budget should reflect Americans’ priorities.
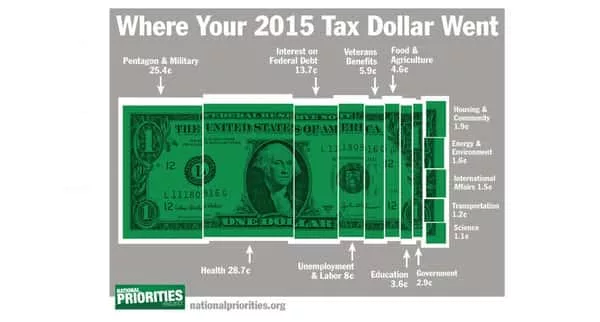
National Priorities Project (NPP) has just released its annual to-the-penny breakdown of how the federal government spent each dollar of income taxes paid by individuals in 2015.
Lindsay Koshgarian is Research Director for the National Priorities Project. She contends, “Americans might be surprised to learn how their tax dollars are spent.” She points out, “For example, 25.4 cents of every federal income tax dollar goes to the Pentagon and military, while just 3.6 cents goes to education.
Koshgarian says, “What we see in poll after poll is that Americans would like to see more investment in domestic spending programs such as job training, infrastructure improvements, and education programs. Unfortunately, what the data shows us is that our tax dollars don’t reflect our priorities.”
Out of every federal income tax dollar paid in 2015, 25.4¢ went to military and war, 28.7¢ went to health programs, 13.7¢ went to interest on federal debt, 8¢ went to unemployment and labor, 5.9¢ went to veterans’ benefits, and just pennies went to each of food and agriculture, government, education, transportation, housing and community, science, international affairs, and energy and environment programs.
To help Americans understand where their tax dollars go, National Priorities Project provides a suite of interactive web resources:
- An average taxpayer’s receipt for the United States (on average, Americans paid about $13,000 in federal income taxes in 2015).
- State-by-state receipts showing what the average taxpayer in each state and the District of Columbia paid last year in federal income taxes. In 2015, Connecticut taxpayers paid the most on average in federal income taxes ($21,367), while West Virginia taxpayers paid the least ($7,886).
- A personalized individual tax receipt calculator which shows a detailed breakdown, including spending on specific initiatives like job training, Medicaid, the federal prison system, and the Environmental Protection Agency, among others.
The research expert says, “Individual taxpayers’ income taxes are the largest source of federal revenues every year – which means individuals are the primary bill-payer of the federal government. That’s why the federal budget belongs to them – to all of us – and why we should know how our tax dollars are being spent.”
You can find tax day resources online from National Priorities Project researchers by clicking the link below:
National Priorities Project (NPP) is a non-partisan, non-profit organization founded in 1983 that makes the complex federal budget transparent and accessible so people can exercise their right and responsibility to shape the nation’s budget. In 2014, NPP was nominated for the Nobel Peace Prize in recognition of pioneering work to track federal spending on the military and promote a U.S. federal budget that represents Americans’ priorities.